Straco develops, operates and invests in tourism attractions that combine entertainment, education and culture. Its four operating assets sit in high-traffic tourism nodes in China and Singapore — but the portfolio has not regained pre-COVID demand, and the lease clock is now a strategic variable.
By Jiarun Yang, 1 September 2026Beyond Our Gallery · Asset economics, capital allocation and the path beyond recovery
SGX: S85
Research score
Straco Corporation scores 67.3 out of 100 — Satisfactory
Exceptional financial resilience and asset economics, constrained by geographic concentration, tourism cyclicality and an underdeveloped expansion pipeline. This is a business-quality score, not a valuation or investment recommendation.
67.3out of 100Satisfactory
Financial Strength 35.3 / 40
Market Position 11.6 / 20
Growth Opportunities 10.6 / 25
Risk Resilience 9.8 / 15
Evidence grade B
Versus Kingsmen +8.0
“Strong” threshold 70
What lifts the score
Straco's balance sheet, margins and cash generation are its defining strength — 35.3 of a possible 40 for Financial Strength, with full marks for both median net margin and balance-sheet strength.
What holds it back
It sits 2.7 points below the 70-point “Strong” threshold. Concentrated assets, cyclical visitor demand and limited evidence of substantial new growth engines cap the result — Growth Opportunities scores just 10.6 of 25.
Four scarce-location attractions, strong margins — and a demand base still a third below FY2019
Four attractions in China and Singapore, about 450 staff, and net cash equal to two-thirds of the market capitalisation. Revenue is still 31.7% below FY2019 and visitor numbers only 64% of pre-pandemic levels. The question this report sets: can an ageing four-asset portfolio become a repeatable platform before the lease clocks run down?
S$74.4mFY2025 revenue
2.95mFY2025 visitors
46.9%EBITDA margin
S$176.4mNet cash
Read the full analysisCollapse this section
S$74.4m
FY2025 revenue
−8.7% YoY, and 31.7% below FY2019.
S$34.9m
FY2025 EBITDA
46.9% margin; −14.9% on normalized FY2024.
2.95m
FY2025 visitors
−12.2% YoY; only 64% of the FY2019 base.
S$176.4m
H1 FY2026 net cash
20.6 cents per share — 66.5% of market value.
Founded
2002
Listed on the SGX Mainboard in 2004. Around 450 employees across China and Singapore.
H1 FY2026 revenue
S$26.4m
−19.3% YoY, with Flyer rides paused for one month during a spoke-cable replacement.
H1 FY2026 PBT
S$5.2m
−43.1% YoY; underlying profit excluding FX fell 63%.
Ticket concentration
88.4%
S$65.7m of revenue is ticketing; only 11.6% comes from ancillary spend and rent.
The four operating assets
SOA · Shanghai · 95%
Flagship aquarium beside the Oriental Pearl Tower. 20,500 sqm across nine themed zones, 15,000+ animals, 21,000 daily design capacity.
UWX · Xiamen · 100%
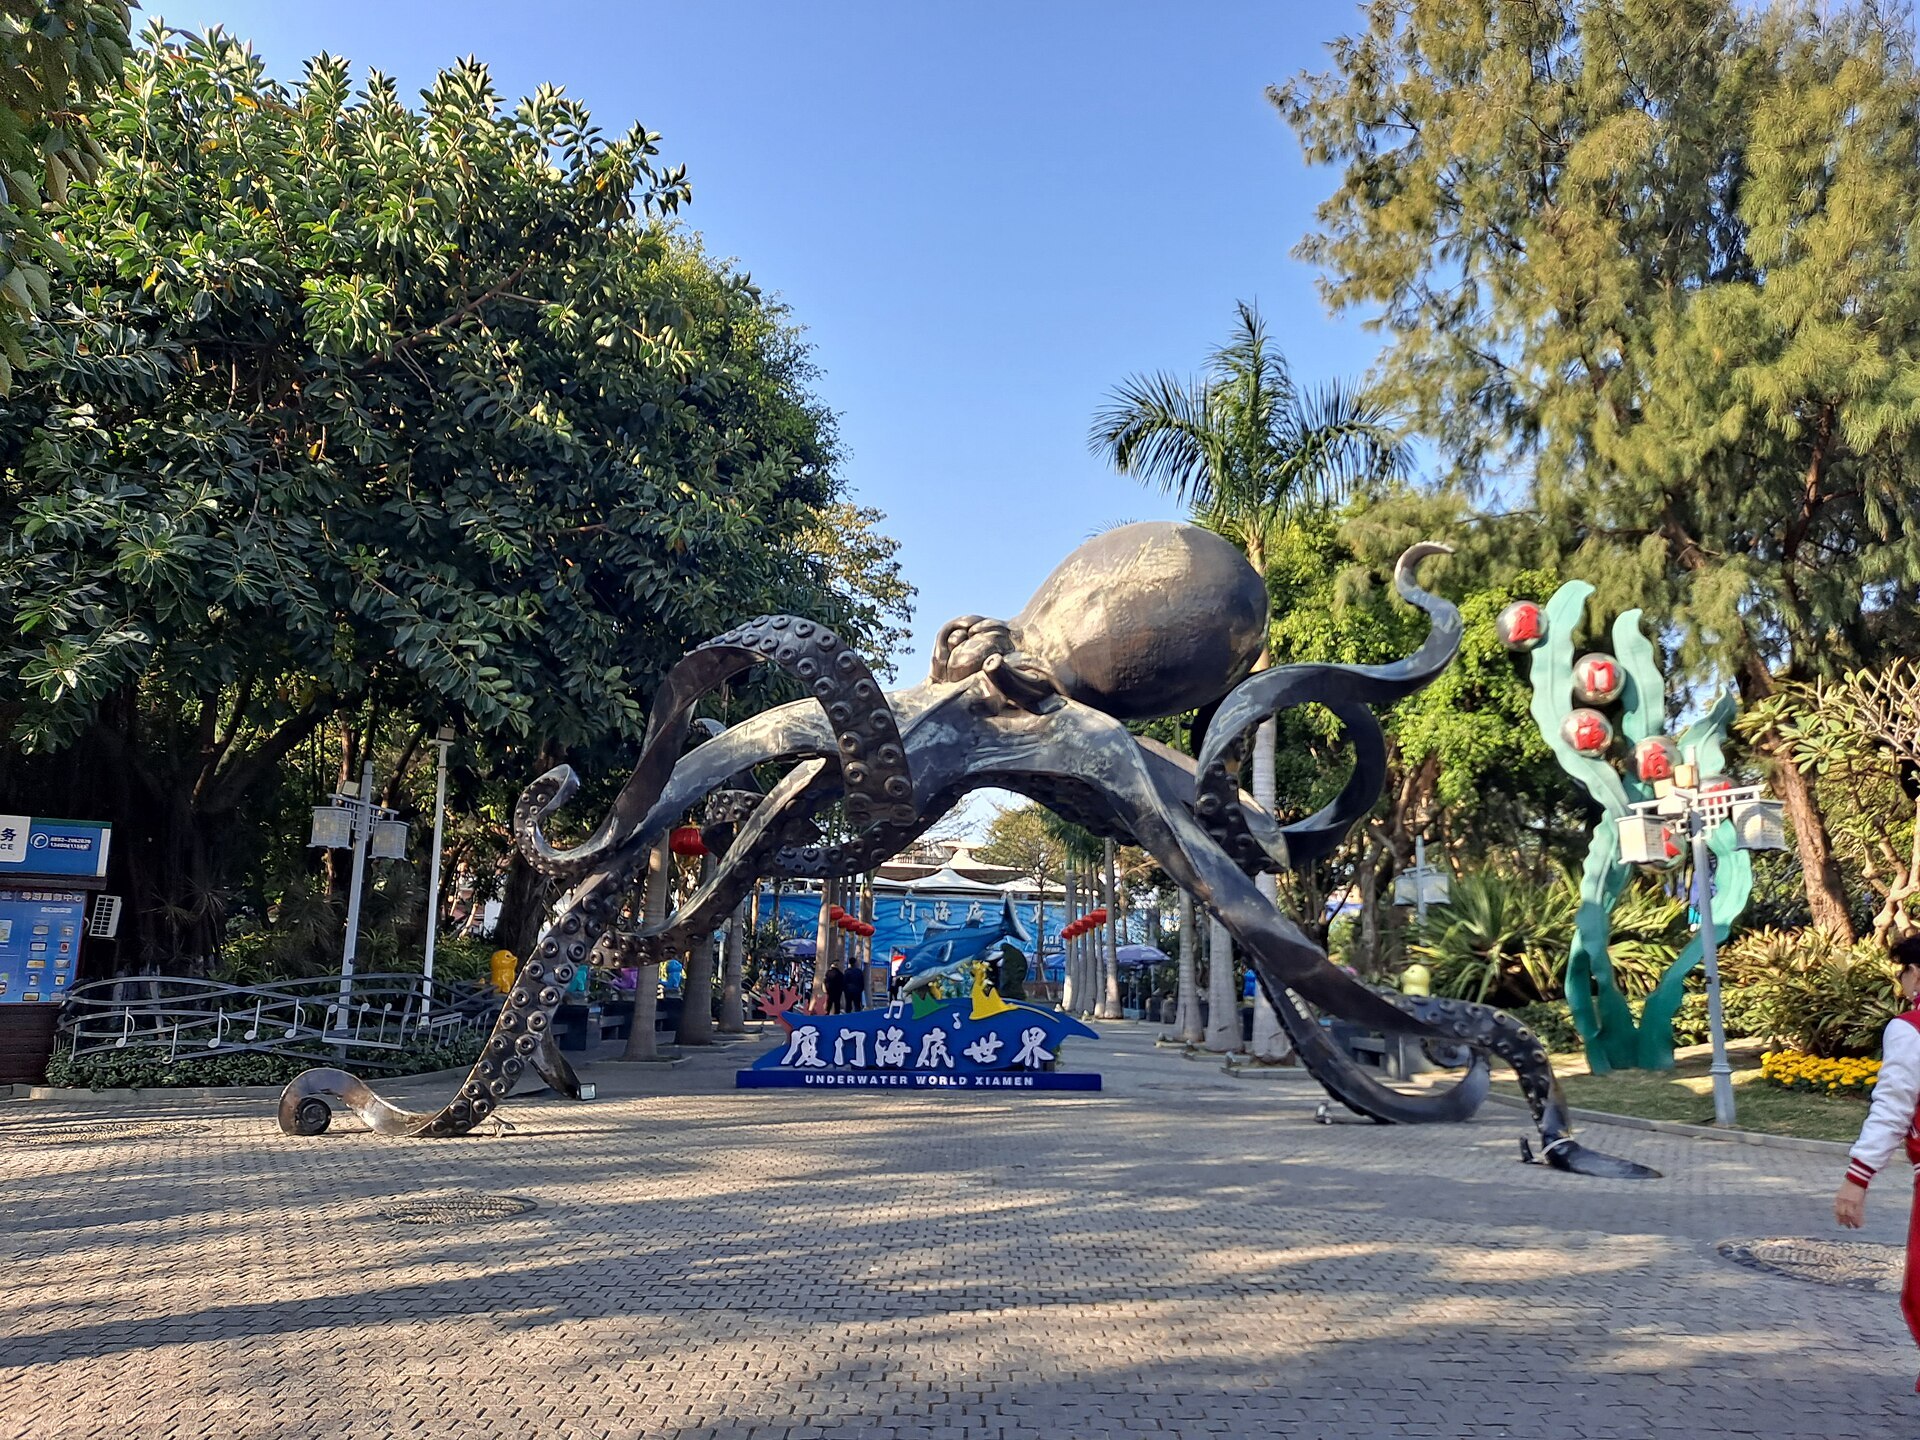
Island aquarium on Gulangyu with 5.8m litres of water and national education-base status in Fujian.
Flyer · Singapore · 90%
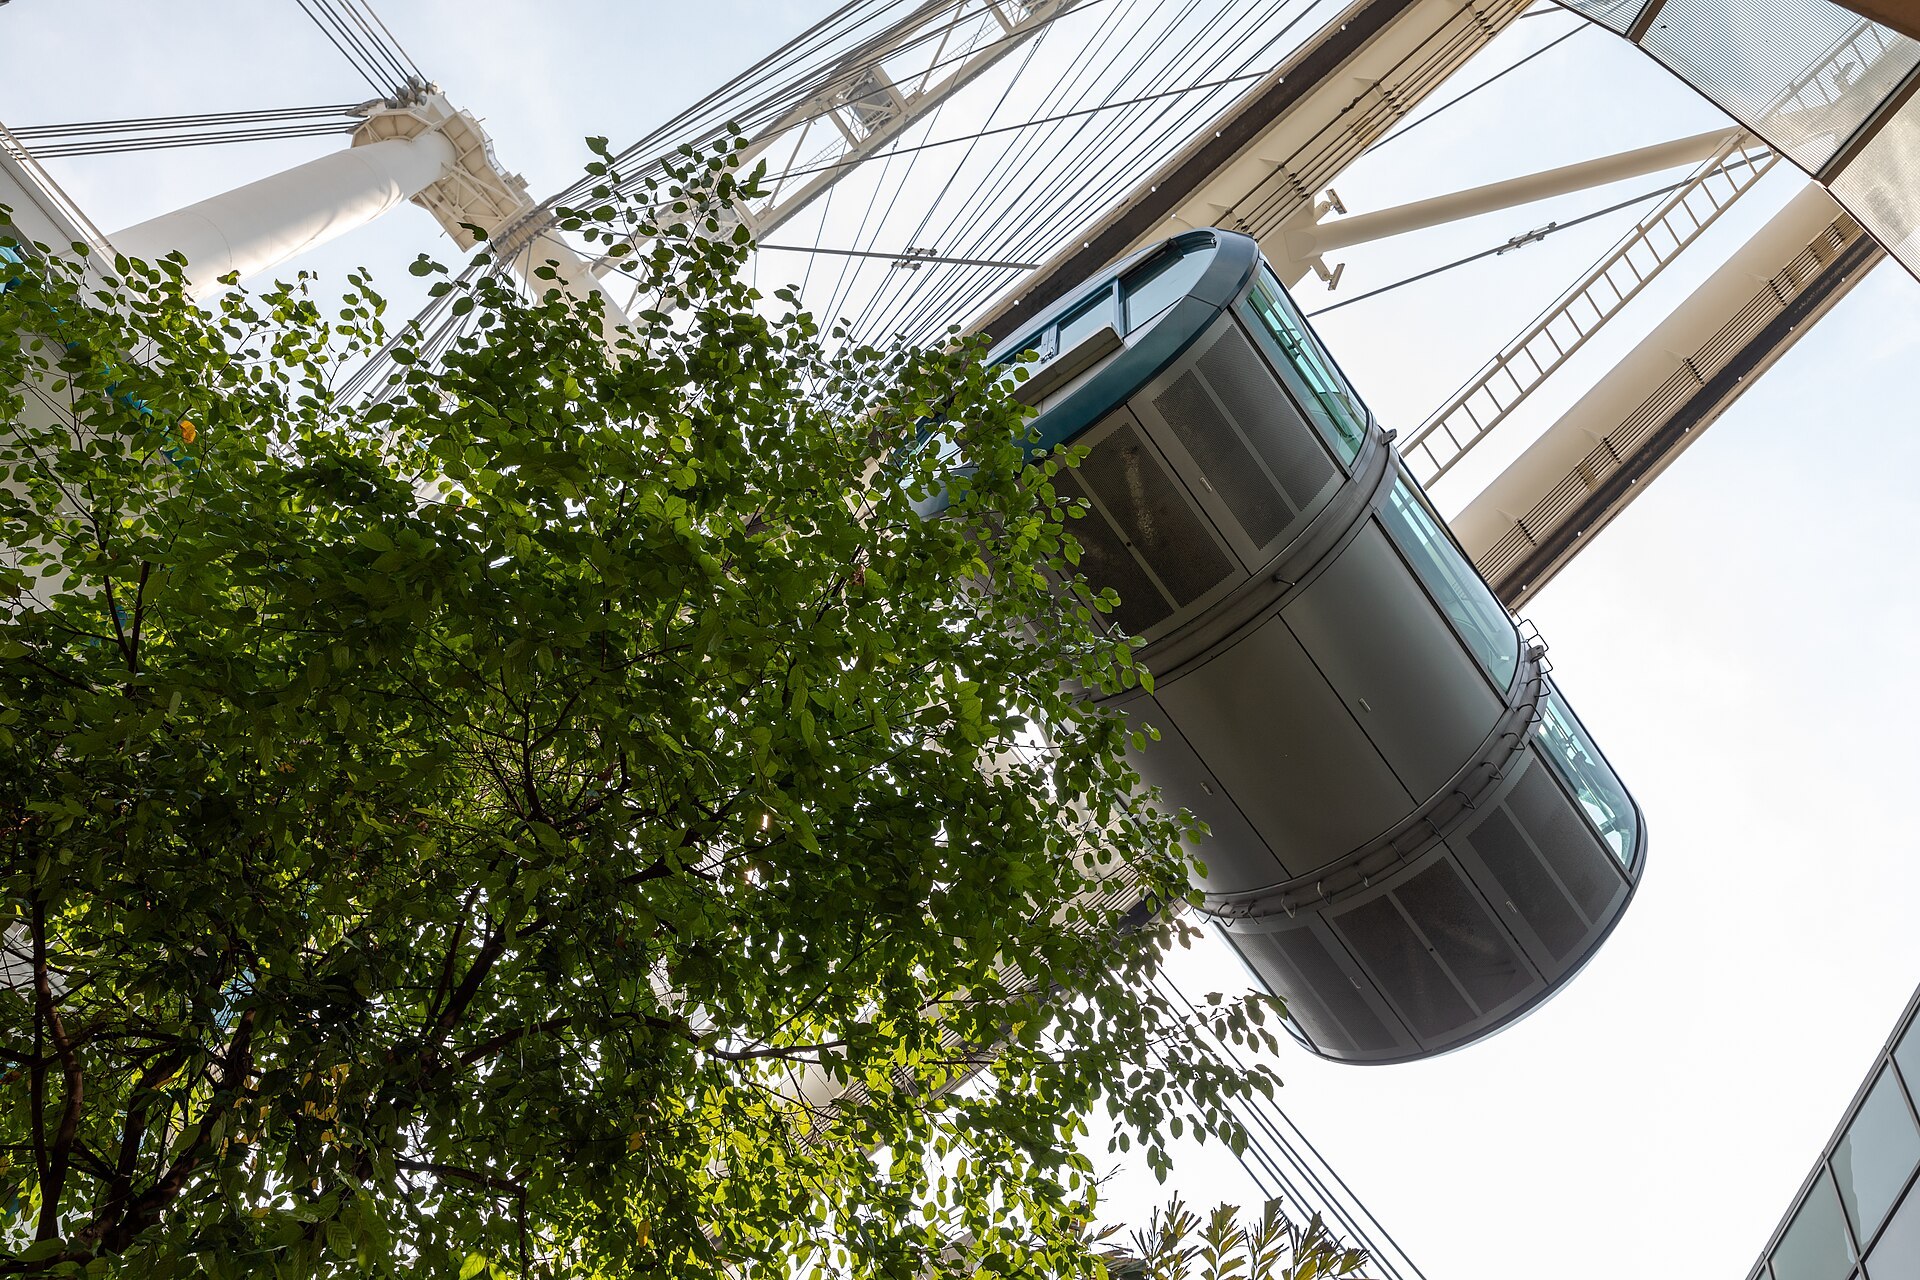
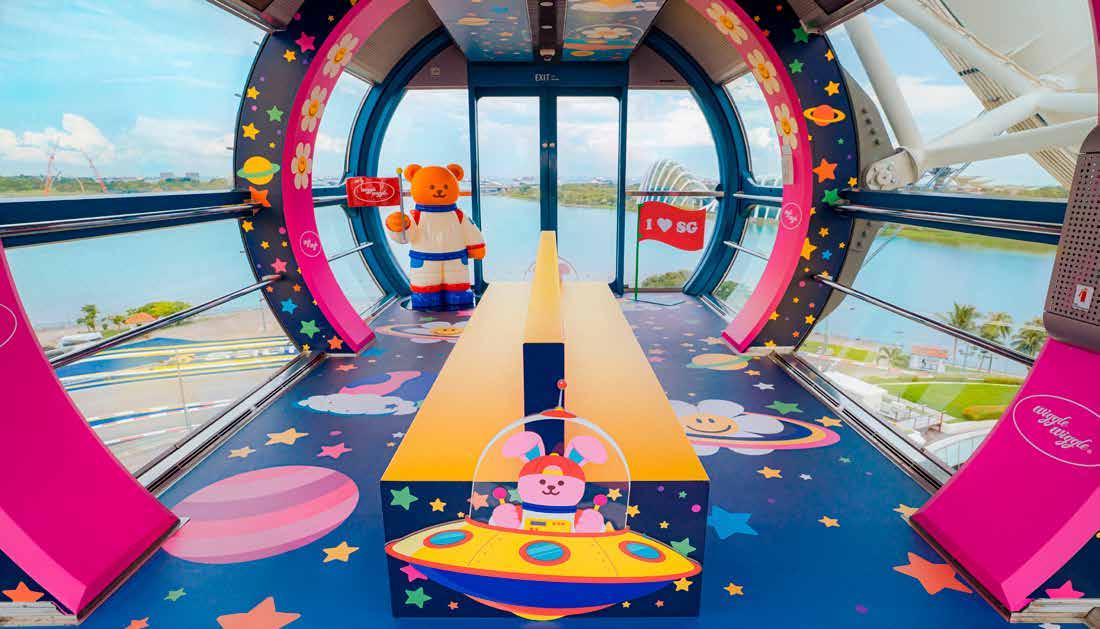
165 m observation wheel at Marina Bay with 28 capsules, Time Capsule, premium dining, events and retail property.
LCC · Xi'an · 95%
A 1.5 km cable car linking the base of Mount Lishan to its mid-level, near Hua Qing Palace.
Singapore Flyer, Marina Bay — the group's largest single asset by revenue. Photo: Dietmar Rabich / Wikimedia Commons / CC BY-SA 4.0.
Executive thesis · the core question
Can a cash-rich but ageing four-asset portfolio become a repeatable attractions platform before the lease clocks shorten further?
The balance sheet protects the downside; only renewed growth and lease clarity unlock the upside. At S$0.31, the market already recognises the cash but gives little credit for reinvestment.
1 · What worksScarce locations. SOA sits beside the Oriental Pearl Tower; the Flyer anchors Marina Bay. Location creates awareness and replacement-cost advantages.
2 · What brokeDemand capture. FY2025 visitors were only 64% of FY2019 — tourism markets recovered faster than Straco's own attendance.
3 · What mattersAsset duration. UWX expires in 2034, the Flyer base term in 2035 and SOA in 2037. Renewal terms determine residual value.
4 · What changesCapital allocation. Net cash equals 66.5% of market value, but over half of FY2025 cash sat in China under exchange controls.
The opportunity chain
Straco converts destination footfall into cash through a short, high-operating-leverage chain. Unlike a contractor, it has no backlog and almost no revenue lag: a lost visitor or maintenance day hits revenue immediately, while employee, depreciation, repair and utility costs largely remain.
1 · ATTRACT
Destination demand
Domestic travel, inbound arrivals, school groups, MICE and local leisure create the addressable pool.
2 · CONVERT
Itinerary capture
Location, digital platforms, tour operators and bundled offers determine visitation share.
3 · MONETISE
Yield and mix
Ticket price, premium products, F&B, retail, events and rent determine spend per visitor.
4 · OPERATE
Availability
Maintenance, animal care, utilities and safety keep capacity online; downtime destroys high-margin volume.
5 · RENEW
Asset duration
Concessions and leases define the years available to recover enhancement capital and terminal value.
02 Portfolio & asset review
Aquariums provide 58% of revenue and 85% of segment profit; the Flyer supplies scale but volatile returns
Shanghai Ocean Aquarium is the group — S$26.3m of PBT at a 65.6% margin — while the Singapore Flyer turns almost every lost revenue dollar into a lost profit dollar. Xiamen is constrained by a 2034 lease and the cable car is a cash harvest. Two rules follow: treat the Flyer as a turnaround, and make lease duration a capital gate.
56.8%Aquarium PBT margin
11.4%Singapore Flyer PBT margin
95.6%Flyer decremental margin
2034–37Weighted lease cliff
Read the full analysisCollapse this section
FY2025 revenue mixS$ millionFY2025 segment PBT poolS$ million · before S$1.2m net unallocated items
Shanghai Ocean Aquarium, Lujiazui
Shanghai Ocean Aquarium · Lujiazui
Owned95%
Subsidiary PBTS$26.3m
PBT margin65.6%
Lease expiryNov 2037
Adult ticketRMB160
The earnings anchor. The flagship's site beside the Oriental Pearl Tower creates natural footfall, and its variable rent partly flexes with revenue, supporting resilience. 20,500 sqm across nine themed zones, with a 21,000 daily design capacity.
Commercial read-throughSOA's 2025 visitors rose single digit even as the group declined; improved yield management offset softer holiday footfall. The main risk is not capacity — it is relevance and conversion in a price-sensitive market before the 2037 lease decision.
FY2025 revenueS$40.0m
Underwater World Xiamen, Gulangyu
Underwater World Xiamen · Gulangyu
Owned100%
Water capacity5.8m L
Acquired2007
Lease expiryOct 2034
2024 impairmentS$1.4m
Strategically constrained: a smaller aquarium in a competitive island market with the earliest lease cliff. It benefits from island visitation and education status — the only national base in Fujian — but ferry access, platform commissions and the 2034 expiry cap investment duration.
Commercial read-throughThe goodwill impairment and short remaining tenure argue for a harvest-and-renew plan, not open-ended enhancement capex. A binding renewal by 2028 would restore a six-year-plus payback window; without it, capex should remain safety-led.
Rent escalation+10% / 4 yrs
Singapore Flyer capsule, Marina Bay
Singapore Flyer · Marina Bay
Owned90%
FY2025 PBTS$3.1m
Reported margin11.4%
H1 FY2026 PBT−S$2.7m
Base leaseJul 2035
Straco's swing factor: iconic demand, but maintenance downtime turns revenue loss into near one-for-one profit loss. The asset combines a 165 m wheel, Time Capsule, premium dining, events and retail property, with a +15-year renewal option.
Commercial read-throughNormalized FY2025 PBT was about S$2.5m after removing a S$0.6m property impairment write-back — a 9% margin. H1 FY2026 PBT fell S$4.7m on S$4.9m lower revenue: a 95.6% decremental margin that demonstrates fixed-cost intensity.
FY2025 revenueS$27.6m
Lintong Lixing Cable Car, Mount Lishan
Lintong Lixing Cable Car · Mount Lishan
Owned95%
FY2025 PBTS$1.3m
Segment margin38.4%
Revenue change−28.2%
2025 incidents0
Small but profitable; its role is cash harvest and safe operations, not group-level growth. The 1.5 km route links the base to Mount Lishan's mid-level near Hua Qing Palace, taking five to ten minutes. Demand depends on district visitation and route relevance.
Commercial read-throughRevenue declined sharply, but management said the fall was narrower than the broader district benchmark. Given its size, management should optimise cash yield and safety rather than allocate scarce corporate attention to expansion.
FY2025 revenueS$3.3m
Asset and segment synthesis
Asset / segment
FY25 revenue
FY25 PBT
PBT margin
Tenure
Commercial conclusion
Aquariums
S$43.5m
S$24.7m
56.8%
UWX 2034 / SOA 2037
Protect and renew; SOA funds the group
Singapore Flyer
S$27.6m
S$3.1m
11.4%
2035 + option
Restore availability before new capex
Flyer, normalized
S$27.6m
S$2.5m
9.2%
Same
Only a 1.8% PBT return on its S$140m acquisition cost
Others / LCC
S$3.3m
S$1.3m
38.4%
Not disclosed
Harvest cash; keep safety first
Group
S$74.4m
S$27.9m
37.5%
Weighted cliff 2034–37
Cash-rich, but earnings concentration is high
Decision one
Treat the Flyer as a turnaround
Recovery should carry explicit return thresholds rather than being reported as a market-volume problem.
Decision two
Make lease duration a capital gate
No major enhancement or acquisition should outrun the legal right to operate the asset it improves.
03 Financial profile
The 2023 rebound plateaued: FY2025 profit fell faster than revenue because Flyer operating leverage overwhelmed stable aquarium margins
The 2023 rebound plateaued: revenue has compounded at −4.8% since FY2023 and normalised PBT fell 21.9%. Free cash flow dropped 41% to S$19.8m against S$17.1m of dividends. H1 FY2026 was sharper still — revenue down 19.3%, PBT down 43.1%, and operating costs down only 1.7%.
−4.8%Revenue CAGR since FY2023
S$27.3mNormalised PBT
S$19.8mFree cash flow
−19.3%H1 FY2026 revenue
Read the full analysisCollapse this section
Revenue and EBITDA, FY2021–25S$ million
RevenueEBITDA
−31.7%
FY2025 vs FY2019 revenue
S$74.4m against S$108.8m.
−36.0%
Visitors vs FY2019
2.95m against approximately 4.61m.
−4.8%
2023–25 revenue CAGR
A post-reopening plateau, not a recovery.
46.9%
FY2025 EBITDA margin
High margin despite weak utilisation.
Segment profitability bridge
S$m
FY2024
FY2025
Change
FY25 margin
Aquarium revenue
46.0
43.5
−5.5%
—
Aquarium PBT
25.6
24.7
−3.7%
56.8%
Giant wheel revenue
30.9
27.6
−10.7%
—
Giant wheel PBT, reported
8.6
3.1
−63.4%
11.4%
Giant wheel PBT, normalized
7.3
2.5
−65.2%
9.2%
Others PBT
2.6
1.3
−50.3%
38.4%
Group PBT
36.2
27.9
−23.0%
37.5%
Flyer decremental margin · 144%
Normalized PBT fell about S$4.75m on S$3.30m lower revenue. More than every lost revenue dollar passed through, because fixed costs and maintenance persisted.
Implication
Cost cutting alone cannot repair the Flyer. The priority order is availability, then volume capture, then premium mix, and only then cost flex.
Earnings quality and normalization
Reported FY2024 overstated the base, but normalized FY2025 still declined 22%. Cash interest cushions profit — it is not evidence of operating growth.
PBT normalization bridge (S$m)
FY2024
FY2025
Reported PBT
36.2
27.9
Less: contractor settlement
(3.0)
—
Add: goodwill impairment
+1.4
—
Add: investment property impairment
+0.3
—
Less: investment property write-back
—
(0.6)
Normalized PBT
34.9
27.3
Normalized change
—
−21.9%
S$3.6m
Interest income
13.0% of FY2025 PBT, down from S$4.5m.
31.1%
Tax rate
Higher than 19.1% in FY2024 on mix and one-offs.
S$18.0m
Attributable profit
−34.0% YoY; EPS of 2.10 cents.
S$34.9m
Normalized EBITDA
FY2024 comparable was about S$41.0m.
Free cash flow and reinvestment
Operating and free cash flow, FY2021–25S$ million
Operating cash flowFree cash flow
S$27.3m
FY2025 operating cash flow
−26.8% YoY; 1.52× attributable profit.
S$7.5m
FY2025 capex
+103.7% YoY on exhibits and the Time Capsule.
S$19.8m
FY2025 free cash flow
A 26.6% FCF margin, but −41.1% YoY.
S$17.1m
Dividend paid
FY2024 payout, plus S$0.8m to minorities.
Capex discipline
Every major project should carry a visitor, yield or downtime KPI and a payback period that fits inside the lease plus a three-year buffer.
Five-year operating and return schedule
S$m unless stated
FY2021
FY2022
FY2023
FY2024
FY2025
Revenue
41.9
28.2
82.1
81.5
74.4
EBITDA
27.4
(5.9)
42.9
44.0
34.9
Attributable profit
11.6
(10.8)
25.7
27.2
18.0
Operating cash flow
20.3
(3.0)
37.1
37.3
27.3
Cash capex
4.1
2.5
4.0
3.7
7.5
Free cash flow
16.2
(5.5)
33.1
33.6
19.8
FCF margin
38.7%
(19.5%)
40.3%
41.2%
26.6%
Basic EPS (cents)
1.36
(1.26)
3.00
3.18
2.10
DPS declared (cents)
1.00
1.00
2.00
2.00
1.50
ROE
n/d
n/d
n/d
10.15%
6.57%
Current trading shock
H1 FY2026 exposed the downside: the Flyer swung to a loss and profit excluding FX fell 63%. Expenses declined only 1.7% after removing FX, against 19% lower revenue — the clearest available proof of fixed-cost intensity.
S$m unless stated
H1 FY2025
H1 FY2026
Change
Revenue
32.7
26.4
−19.3%
Visitors
1.29m
1.06m
−18.0%
Aquarium PBT
7.9
6.8
−13.0%
Giant wheel PBT
2.0
(2.7)
−S$4.7m
Reported PBT
9.0
5.2
−43.1%
PBT excluding FX
10.3
3.8
−63.3%
Operating cash flow
11.3
5.7
−49.6%
Free cash flow
8.0
1.2
−84.9%
04 Market position & valuation
At S$0.31, cash covers two-thirds of equity value and lease-adjusted EV is 3.6× FY2025 EBITDA
At 31.0 cents the market pays roughly S$89m for the operating business — 3.6× EBITDA on a lease-adjusted basis — because net cash covers 66.5% of the market capitalisation. The catch: 54.6% of that cash sits in China under exchange controls, and only 12.45% of the shares float.
S$265.1mMarket cap
20.6cNet cash per share
3.6×Lease-adjusted EV / EBITDA
54.6%Cash held in China
Read the full analysisCollapse this section
S$0.310
Share price
52-week range S$0.265–S$0.405; data at 31 Aug 2026.
S$265.1m
Market capitalisation
855.2m shares excluding treasury.
S$176.4m
H1 FY2026 net cash
20.6 cents per share; 66.5% of market cap.
S$125.1m
Lease-adjusted EV
Market cap less net cash plus S$36.4m of leases.
14.8×
FY2025 P/E
Reported basis.
3.6×
Lease-adj. EV / FY25 EBITDA
Against a 1.0× price-to-NAV.
7.5%
FY2025 FCF yield
With a 4.8% dividend yield.
Equity value decompositionPercent of market capitalisation
The discount is real but not free
54.6% of FY2025 cash was held in China under exchange controls, lease liabilities are S$36.4m, and only 12.45% of shares are in public hands. Valuation is sensitive to 2026 earnings and to how leases are treated.
Spot peer valuation and read-through
Company
Spot EV/EBITDA
Earnings quality
Balance sheet
Read-through for Straco
Straco
3.4–3.6×
Positive, cash-rich
Net cash
5× needs Flyer recovery and a cash decision
Sim Leisure
Screen varies
FY25 distorted by other income
Modest debt / leases
Value design-and-build capability, not headline PBT
Genting Singapore
About 5.5×
Scaled recurring ecosystem
Strong
The closest public multiple ceiling
Oriental Land
About 19×
High-quality IP and yield
Strong
Not an economically replicable benchmark
Haichang
n/m
Loss-making
High leverage
Reject leverage-led scale
05 Demand economics
The market is not waiting for Straco: tourism recovered faster than its own attendance
The recovery happened without Straco. China domestic trips ran at 108.6 against a FY2019 base of 100 while Straco's visitors reached only 64.0 — a gap that points at asset relevance rather than macro conditions. Yield rose to S$22.29 per visitor, but that cannot offset a 12.2% fall in volume.
64.0Visitor index, FY2019 = 100
108.6China domestic trips index
S$22.29Ticket yield per visitor
7.9 yrsShortest lease runway
Read the full analysisCollapse this section
FY2025 yield improved, but volume erosion explains almost all of the revenue gap. The attendance shortfall is an asset relevance problem, not only a macro one.
China domestic trips 108.6
Singapore arrivals 88.5
Straco revenue 68.3
Straco visitors 64.0
Recovery index, FY2019 = 100. Bars are scaled to a 145-point axis.
2.95m
FY2025 visitors
−12.2% YoY; only 64% of FY2019.
S$22.29
Ticket yield per visitor
+2.9% YoY, calculated.
S$2.93
Ancillary per visitor
+10.0% YoY, partly rental mix.
5.4 / 10
Revenue quality score
High cash collection and location quality; low visibility, diversity and repeatability.
China · volume growth spread −28.4 points
Domestic trips rose 16.2% to 6.52bn and tourism spend rose 9.5% to RMB6.3tn, while Straco visitors fell 12.2%. Spend per trip fell about 5.7%, so value sensitivity is real — but it does not explain a 28-point capture gap on its own.
Singapore · arrival growth spread −13.0 points
Arrivals rose 2.3% to 16.9m and receipts rose 10.0% to S$32.8bn, while Flyer revenue fell 10.7%. The destination expanded while the Flyer contracted, so availability, itinerary inclusion, product freshness and conversion matter more than arrivals alone.
Three demand logics
Each asset has a different demand engine; one group-level marketing plan will misallocate spend.
SOA + UWX · domestic family and education
Triggers: school holidays, weekends, family outings, curriculum relevance and local social commerce.
Friction: value sensitivity, novelty decay and competing indoor attractions.
Best KPI: local repeat rate and paid social conversion.
Singapore Flyer · inbound itinerary and premium occasion
Triggers: inbound arrivals, MICE, cruises, Marina Bay itineraries, celebrations and clear weather windows.
Friction: downtime, weak itinerary inclusion and substitute viewpoints.
Best KPI: availability and share of inbound itineraries.
Lixing Cable Car · derived route traffic
Triggers: Mount Lishan and Huaqing Palace visits, route convenience, queues and group-tour flow.
Friction: destination bypass, weather, road alternatives and capacity bottlenecks.
Best KPI: capture of scenic-area visitors.
Lease and concession runway
Three core assets face renewal decisions within 8 to 11 years. Duration is now a strategic KPI, measured at 1 September 2026.
Years to base expiryYears remaining from 1 September 2026
Capital gate
Do not approve discretionary capex above S$2m unless expected payback ends at least three years before base expiry — or renewal is contractually secured.
Macro-to-asset transmission
External driver
SOA
UWX
Flyer
LCC
Typical lag
Primary margin channel
China domestic trips
MED
HIGH
LOW
HIGH
Same qtr
Attendance and channel mix
China real spend / confidence
MED
HIGH
MED
MED
0–2 qtrs
Discounting and ancillary spend
Singapore inbound arrivals
LOW
LOW
HIGH
LOW
Same qtr
Itinerary capture and ticket mix
MICE, cruises and events
LOW
LOW
HIGH
LOW
Same qtr
Premium and group bookings
Asset availability / weather
MED
MED
VERY HIGH
HIGH
Immediate
Sellable hours and fixed-cost absorption
CNY / SGD translation
HIGH
HIGH
LOW
HIGH
Reporting
Revenue translation and cash value
Lease and landlord terms
MED
HIGH
HIGH
MED
Multi-year
Rent, capex payback and terminal value
Model rule
Forecast each asset separately, then reconcile to group visitors. Destination growth is an input; capture, availability and yield determine the earnings outcome.
Per-visitor economics and sensitivity
Sensitivity
Approx. PBT impact
Operating meaning
+1% group ticket price
+S$0.56m
Yield without volume loss
+5% group visitors
+S$1.9m
At 50% contribution
+S$1 ancillary per visitor
+S$1.3m–1.6m
At 45–55% contribution
10-day Flyer closure
−S$0.65m
About S$65k per day
−100bp cash yield
−S$1.87m
Balance-sheet earnings risk
Group revenue per visitor was S$25.21 in FY2025. Contribution per lost visit is an illustrative S$11–S$14 at a 45–55% incremental margin. Attendance break-even cannot be calculated from public disclosure without Flyer visitors, realised yield and a fixed/variable cost split.
06 Competitive position
High substitutes and buyer power cap ticket pricing; location and permits protect supply, not demand
The moat is the site, not the customer. Location and permits score 4.5 out of 5 and the balance sheet a full 5.0, but proprietary IP, first-party data and switching costs all score 1.5 or below — so demand has to be won again every season. The implication is to buy one portable capability rather than more square metres.
5.0Balance-sheet capability
4.5Location and permits
1.5Proprietary IP and data
1.0Customer switching cost
Read the full analysisCollapse this section
Force
Intensity
Evidence
Strategic implication
Rivalry
HIGH
New attractions, refreshed parks and destination competition
Win itinerary share; refresh faster than peers
Buyer power
HIGH–MED
OTAs expose prices and reviews; leisure is discretionary
Own customer data and create hard-to-compare bundles
Supplier power
MED–HIGH
Specialist maintenance, animal care, utilities and landlords
Dual-source spares; secure renewals before major capex
New entrants
LOW–MED
Land, permits, capital, safety systems and operating know-how
Prefer concessions and brownfield assets over greenfield
Substitutes
HIGH
Viewpoints, museums, malls, cruises, gaming and digital leisure
Sell distinctive moments, not generic admission
Net result
A moat at the site level does not guarantee pricing power at the customer level. Product renewal and conversion capability are the missing bridge.
Capability advantage
Straco has a site moat and a balance-sheet moat, but not yet a customer-data or IP moat. Scores are a 1-to-5 diagnostic assessment based on public disclosure.
Balance sheet 5.0
Location and permits 4.5
Operating know-how 4.0
Brand recognition 3.0
Proprietary IP and story 1.5
First-party data and CRM 1.5
Customer switching cost 1.0
Defensible today · scarce addresses
Prime-location replacement cost, operating permissions, animal-care systems and liquidity make the existing portfolio difficult to replicate.
Build next · repeatable demand capability
Customer identity, content cadence, proprietary programs and direct conversion must travel across assets — otherwise Straco remains a collection, not a platform.
Peer capability comparison
Company
Scale
Cash / leverage
IP + novelty
Portfolio model
Lesson for Straco
Straco
Small
Net cash
Low
4 owned assets
Convert liquidity into portable capability
Sim Leisure
Small
Net cash-like
Med–high
Operate + design + build
Capability can diversify asset risk
Haichang
Large
High leverage
Medium
Owned + asset-light + IP
Scale without balance-sheet discipline destroys value
Oriental Land
Very large
Strong
Very high
Destination ecosystem
Yield and mix can grow with flat attendance
Genting Singapore
Very large
Strong
High
Integrated resort
Refreshes create reasons to revisit
Positioning
Straco should not imitate peer scale. It should acquire one portable capability — operating concessions, edutainment IP or membership and data — that raises returns across its existing sites.
PESTLE scan
Political
Tourism stimulus, visa rules, ticket-price sensitivity and local-government relationships.
Response: build policy scenarios and preserve stakeholder trust.
Economic
Travel volume can rise while spend per trip falls; FX and cash yields move profit.
Response: separate volume, real spend and FX in forecasts.
Response: program repeatable seasonal reasons to visit.
Technology
OTAs, short video, CRM, dynamic bundles and predictive maintenance shift conversion.
Response: own funnel data; instrument uptime and demand.
Legal
Leases, safety, wildlife and CITES, food, labour and personal-data rules set operating limits.
Response: make renewal and compliance board-level gates.
Environment
Energy, water, heat, animal welfare and weather affect cost and licence to operate.
Response: publish welfare outcomes and energy intensity.
07 Risk
Lease renewal and capital misallocation carry more permanent downside than a weak tourism quarter
Eight risks, two of them very-high impact: lease renewal and capital misallocation. Each carries a named early indicator — no binding Xiamen renewal path by FY2028, Flyer availability below 98%, a deal failing the 10% free-cash-flow yield test — so the board can act before the number moves.
8Risks in the matrix
2Rated very-high impact
98%Flyer availability threshold
FY2028Xiamen renewal milestone
Read the full analysisCollapse this section
Risk
Likelihood
Impact
Early indicator / trigger
Mitigation
Lease renewal
MEDIUM
VERY HIGH
No UWX binding path by FY2028
Renew before large capex; scenario terminal value
Flyer downtime
MEDIUM
HIGH
Availability below 98% or repeat closures
Critical spares; predictive maintenance; outage plan
Attendance / spend
HIGH
HIGH
Asset demand trails market by more than 10 points
Refresh cadence; local membership; channel tests
Capital misallocation
MEDIUM
VERY HIGH
Deal fails 10% FCF yield or 70% stress case
Independent investment committee and post-audit
RMB / repatriation
MEDIUM
MEDIUM
PRC cash remains above 50% of total
Match local uses; staged dividends; disclose mobility
Every risk owner reports a leading KPI, a threshold and a pre-approved action — not only a narrative status.
08 Strategy
Four proofs: capture, yield, duration and allocation
Four proofs in sequence — capture, yield, duration, allocation. Fix the Flyer first with S$3–5m over two years targeting an 18–22% PBT margin, lift non-ticket revenue from 11.6% to 15%, settle the leases before any large capex, then deploy S$96.4m against hard gates or return at least S$40m by FY2028.
S$3–5mFlyer recovery investment
11.6% → 15%Non-ticket revenue mix
S$96.4mDeployable cash
S$40mMinimum return if no deal
Read the full analysisCollapse this section
Sequence matters. Restore Flyer reliability and secure duration before committing surplus cash to another owned asset.
1 · Capture
Can assets regain destination share?
Proof points: the visitor gap versus market, digital conversion, and availability and itinerary share.
2 · Yield
Can spend rise without broad discounting?
Proof points: ticket yield, premium attach, and membership and rent.
3 · Duration
Can renewal protect residual value?
Proof points: UWX by 2028, the Flyer option path, and SOA terms before major capex.
4 · Allocation
Can cash earn above the hurdle?
Proof points: organic returns, one capability-led deal, and a capital-return fallback.
Priority one · a two-year Singapore Flyer recovery plan
A Flyer turnaround can add S$3.1m–S$4.8m of PBT. Reliability is the first commercial initiative, not a maintenance line item.
Direct bundles, premium cabin inventory, event calendar and price fences
+2 points premium attach
Conversion
Hotel, cruise, MICE and destination partnerships; booking-funnel ownership
+3 points direct digital conversion
Space
Reprice tenants, sell corporate events and activate shoulder periods
+S$0.5m annual rent and event revenue
Priority two · revenue diversification without indiscriminate discounting
Raising the non-ticket mix from 11.6% to 15.0% can add S$2.5m of revenue and S$1.2m–S$1.4m of PBT at the FY2025 base.
Aquarium membership
Annual passes, school clubs, sleepovers, classes and night sessions. Measured on repeat rate and prepaid cash.
Premium experiences
Behind-the-scenes access, private cabins, dining and celebration bundles. Measured on attach rate and contribution per slot.
Retail and F&B
Hero merchandise, local collaborations, pre-order and photo products. Measured on spend per visitor and stock turns.
Rent and events
Tenant reset, pop-ups, corporate buyouts and destination activations. Measured on revenue per square metre.
The simple economic test
Every additional S$1 of spend across 2.95m visitors adds S$2.95m of revenue and about S$1.3m–S$1.6m of PBT at a 45–55% contribution margin.
Priority three · asset-duration strategy
Asset
Base expiry
Decision milestone
Commercial objective
Capital rule
UWX
Oct 2034
Binding renewal path by FY2028
At least a 15-year extension on investable terms
No discretionary capex above S$2m before clarity
Flyer land
Jul 2035
Exercise or agree the option path by FY2028
Protect 15-year option economics and downtime rights
Fund recovery; stage structural capex
SOA
Nov 2037
Heads of terms by FY2030
Term and variable-rent structure support refresh returns
Model terminal value at zero until agreed
Priority four · capital allocation and acquisition capacity
About S$96m is strategically deployable. Use it for one capability-led deal, or return at least S$40m.
S$176.4m
H1 FY2026 net cash
The starting point.
−S$55.0m
Core liquidity floor
Retained for operations.
−S$25.0m
Renewal and refurb reserve
Ring-fenced for lease and asset work.
S$96.4m
Deployable capacity
S$60–80m in China; S$25–40m outside it.
Acquisition gate
Minimum requirement
Asset duration
More than 15 years, or freehold
Operating quality
Above a 25% EBITDA margin
Return
Above a 10% post-maintenance FCF yield
Stress case
Break-even at 70% of base attendance
Concentration
No asset above 40% of group EBITDA
Fallback
Return at least S$40m — 4.7 cents per share — if no qualifying deal or renewal clarity arrives by FY2028. Preferred archetypes are indoor family edutainment near transit, management concessions and local operating bolt-ons.
Execution roadmap
Timing
Primary actions
Proof delivered
0–6 months
Flyer reliability war room; asset KPI dashboard; lease taskforce
Availability baseline; owners and deadlines
6–12 months
Pricing and CRM pilots; premium attach; tenant reset; capital policy
Yield uplift and conversion evidence
12–24 months
Renewal heads of terms; replicate aquarium programs; screen targets
Duration clarity and a portable playbook
24–36 months
One acquisition only if all gates clear; otherwise capital return
Disciplined deployment or cash release
09 Scenarios & valuation
FY2026 revenue is likely S$61.8m–S$69.2m; the second half must prove the Flyer can normalize
Probability-weighted fair value of 34.1 cents against 31.0 today — about 10% upside, cross-checked by a DCF at 31.1–38.1 cents. Even the base case leaves FY2030 revenue 25.1% below FY2019. Fair value exists, but the return is catalyst-dependent.
25.0cBear
34.4cBase
42.7cBull
34.1cProbability-weighted
Read the full analysisCollapse this section
FY2026 modelled revenueS$ million
Assumption / output
Bear
Base
Bull
H2 aquarium revenue vs H2 FY25
−15%
−7%
0%
H2 Flyer revenue vs H2 FY25
−15%
0%
+8%
H2 other revenue vs H2 FY25
−15%
−8%
0%
FY2026 revenue
S$61.8m
S$66.1m
S$69.2m
FY2026 PBT
S$17.2m
S$21.4m
S$24.4m
Attributable profit, approx.
S$10.7m
S$13.3m
S$15.1m
EPS, approx.
1.25c
1.55c
1.77c
Decision rule
The base case requires the Flyer to match H2 FY2025 revenue and return to a positive low-teens PBT margin; failure would push the result toward the bear case.
Five-year outcomes to FY2030
FY2030 revenue and PBT by scenarioS$ million
RevenuePBT
FY2030 output
Bear
Base
Bull
Visitors
2.48m
3.04m
3.17m
Revenue
S$65.7m
S$81.5m
S$89.0m
PBT / margin
S$19.3m / 29.4%
S$31.0m / 38.0%
S$36.5m / 41.0%
Attributable profit
S$12.0m
S$19.2m
S$22.6m
EPS / FCF
1.40c / S$11.5m
2.25c / S$21.0m
2.64c / S$26.5m
Base case reaches S$81.5m of revenue by FY2030 — a 5.4% CAGR from FY2026, but still 25.1% below FY2019 in nominal terms, with visitors 34% below. Growth splits roughly Flyer recovery 31%, aquariums 18% and other 38% from FY2026 to FY2030.
Scenario valuation and cross-check
Lease-adjusted fair value per shareSingapore cents · current price 31.0c
25.0c
Bear
3.0× S$24.5m FY27E EBITDA; −19.4% versus 31.0c.
34.4c
Base
5.0× S$30.8m FY27E EBITDA; +11.0%.
42.7c
Bull
6.5× S$34.6m FY27E EBITDA; +37.7%.
34.1c
Probability-weighted
25% bear / 50% base / 25% bull. A DCF cross-check gives 31.1c–38.1c.
Final verdict
Catalyst-dependent watch: fair value exists, but the expected return remains catalyst-dependent.
The five-year model produces a 25.0c–42.7c fair-value range and a 34.1c probability-weighted outcome. Cash limits solvency risk, but only operating and capital-allocation proof can close the discount — a 10% expected upside is insufficient without it.
Proof 1 · Flyer economicsAt least 97% availability and above a 15% PBT margin.
Proof 2 · Capture and durationAt least 2.7m visits and a binding lease path.
Proof 3 · Cash decisionA qualifying deal, or a return of at least S$40m.
Diligence questions
1. What caused the asset-level visitor gap versus destination markets?
2. What is Flyer sellable-hour availability, and what is the maintenance backlog?
3. What renewal discussions, options and rent structures are binding?
4. What are asset-level visitors, realised yield, contribution and break-even attendance?
5. How much PRC cash can be repatriated, on what timeline and at what tax cost?
6. Who can operate and allocate capital independently of the founder-CEO?
Core sources: Straco FY2025 Annual Report (16 Mar 2026) · Straco 1H FY2026 Results (14 Aug 2026) · Straco 2021 AGM responses on the SOA lease · World Bank China Economic Update (7 Jul 2026) · Singapore MTI 2Q 2026 Economic Survey · Singapore Tourism Board 2025 performance and 2026 outlook · China 2025 tourism statistics, State Council · IAAPA State of the Global Attractions Industry 2025.
Market data at 31 August 2026. Normalized figures, scenarios, sensitivities, capability scores and valuation ranges are the author's calculations and assumptions — not company guidance, consensus estimates or a price target.
10 Component scoring
How the 67.3 breaks down across twenty scored components
Twenty weighted components sit behind the 67.3. Balance-sheet strength, median net margin and five-year revenue CAGR all score a full 5.0 — though that 15.4% CAGR flatters, starting from a pandemic base. Technology adoption and new-market expansion score 1.0 and pull growth down to 10.6 out of 25.
35.3 / 40Financial strength
11.6 / 20Market position
10.6 / 25Growth opportunities
9.8 / 15Risk resilience
Read the full analysisCollapse this section
Each component is rated out of five and multiplied by its weight. The four category totals shown at the top of this report are the sums of the components below.
Component
Weight
Score /5
Points
Assessment
Financial Strength
Five-year revenue CAGR
6
5.0
6.0
FY2021–25 CAGR was approximately 15.4%, although heavily inflated by the pandemic-depressed FY2021 base.
Median net margin
7
5.0
7.0
Five-year median was approximately 27.6%, comfortably above the rubric's 20% top threshold.
Median ROIC
9
3.4
6.1
Median ROIC was 12.36%: 3/5 absolutely, adjusted upward for comparatively strong industry profitability.
Cash-flow stability
9
4.0
7.2
Free cash flow was positive in four of five years, with median cash conversion above 100%.
Balance-sheet strength
9
5.0
9.0
FY2025 cash was S$187.1m against only S$2.9m of reported borrowings; management reported net cash of S$183.1m.
Market Position
Brand recognition
2
3.0
1.2
Singapore Flyer and Shanghai Ocean Aquarium are recognisable destination assets; the Flyer ranked within Tripadvisor's top 1% of global attractions.
Competitive advantage
7
4.0
5.6
Prime locations, difficult-to-replicate physical assets, long operating history and unusually strong margins create a meaningful moat.
Market share
4
2.0
1.6
Comparable attraction-level market-share data are unavailable, triggering the rubric's 2/5 default.
Customer relationships
5
2.0
2.0
Strong consumer reach, but no quantified repeat-visitation, retention or membership data.
Geographic reach
2
3.0
1.2
Operates meaningfully in China and Singapore; China generated 62.9% and Singapore 37.1% of FY2025 revenue.
Growth Opportunities
Industry growth potential
6
2.0
2.4
Conservative benchmark is the lower of the 3.3% global tourism-demand forecast and the 5.26% China tourism forecast.
Technology adoption
4
1.0
0.8
Uses digital ticketing, Douyin, WeChat, Meituan and Ctrip, but provides no quantified group-level productivity or margin benefit.
New-market expansion
6
1.0
1.2
Chao Yuan Ge represents committed development activity, but remains unlaunched with no independently demonstrated revenue pipeline.
Revenue diversification
5
3.0
3.0
Aquariums contributed 58.4% of revenue, the Singapore Flyer 37.1%, and other activities 4.5%.
Strategic partnerships
4
4.0
3.2
Active, scalable partnerships with Douyin, Meituan and Ctrip are operational, though their revenue contribution is unquantified.
Risk Resilience
Economic sensitivity
3
1.0
0.6
Revenue fell 32.7% and the company recorded a loss in FY2022, demonstrating high exposure to tourism disruptions.
Customer diversification
4
5.0
4.0
Mass-market visitor base with no material reliance on an individual customer.
Technological resilience
3
4.0
2.4
Physical destination experiences are difficult to automate; Straco has also launched digital sales channels and enhanced attractions.
Regulatory resilience
2
4.0
1.6
Operates across two regulatory systems, with no disclosed material investigation or recent compliance failure.
Operational resilience
3
2.0
1.2
Emergency and continuity controls are established, but revenue remains concentrated in a small number of irreplaceable physical attractions.
Total
100
—
67.3
Satisfactory
Straco versus Kingsmen Creatives
Category
Kingsmen
Straco
Difference
Financial Strength
24.3
35.3
+11.0
Market Position
10.8
11.6
+0.8
Growth Opportunities
15.2
10.6
−4.6
Risk Resilience
9.0
9.8
+0.8
Overall
59.3
67.3
+8.0
Interpretation
Straco is best characterised as a financially excellent but strategically concentrated attraction operator. Its margins, free cash flow and net-cash position are substantially stronger than Kingsmen's. However, the mechanical 15.4% revenue CAGR exaggerates its underlying growth because it begins from a pandemic-affected base: FY2025 revenue was still 8.7% below FY2024, while trailing revenue through June 2026 fell further to S$68.1m.
 SGX: S85